Kamis, 31 Januari 2013

EUR USD BREAKOUT !


EUR/USD is steady, as the pair was trading in the mid-1.35 range. In the US, the GDP release looked awful, posting its first decline since 2009. The Federal Reserve wrapped up its policy meeting, and said that QE3 would continue. Thursday is another busy day, with a host of economic releases. In Germany, Retail Sales declined, but the Unemployment Change was very sharp. Today’s key release is US Unemployment Claims.
EUR/USD Technical
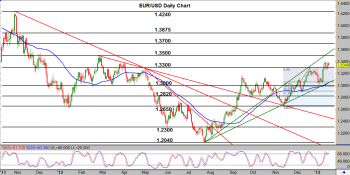
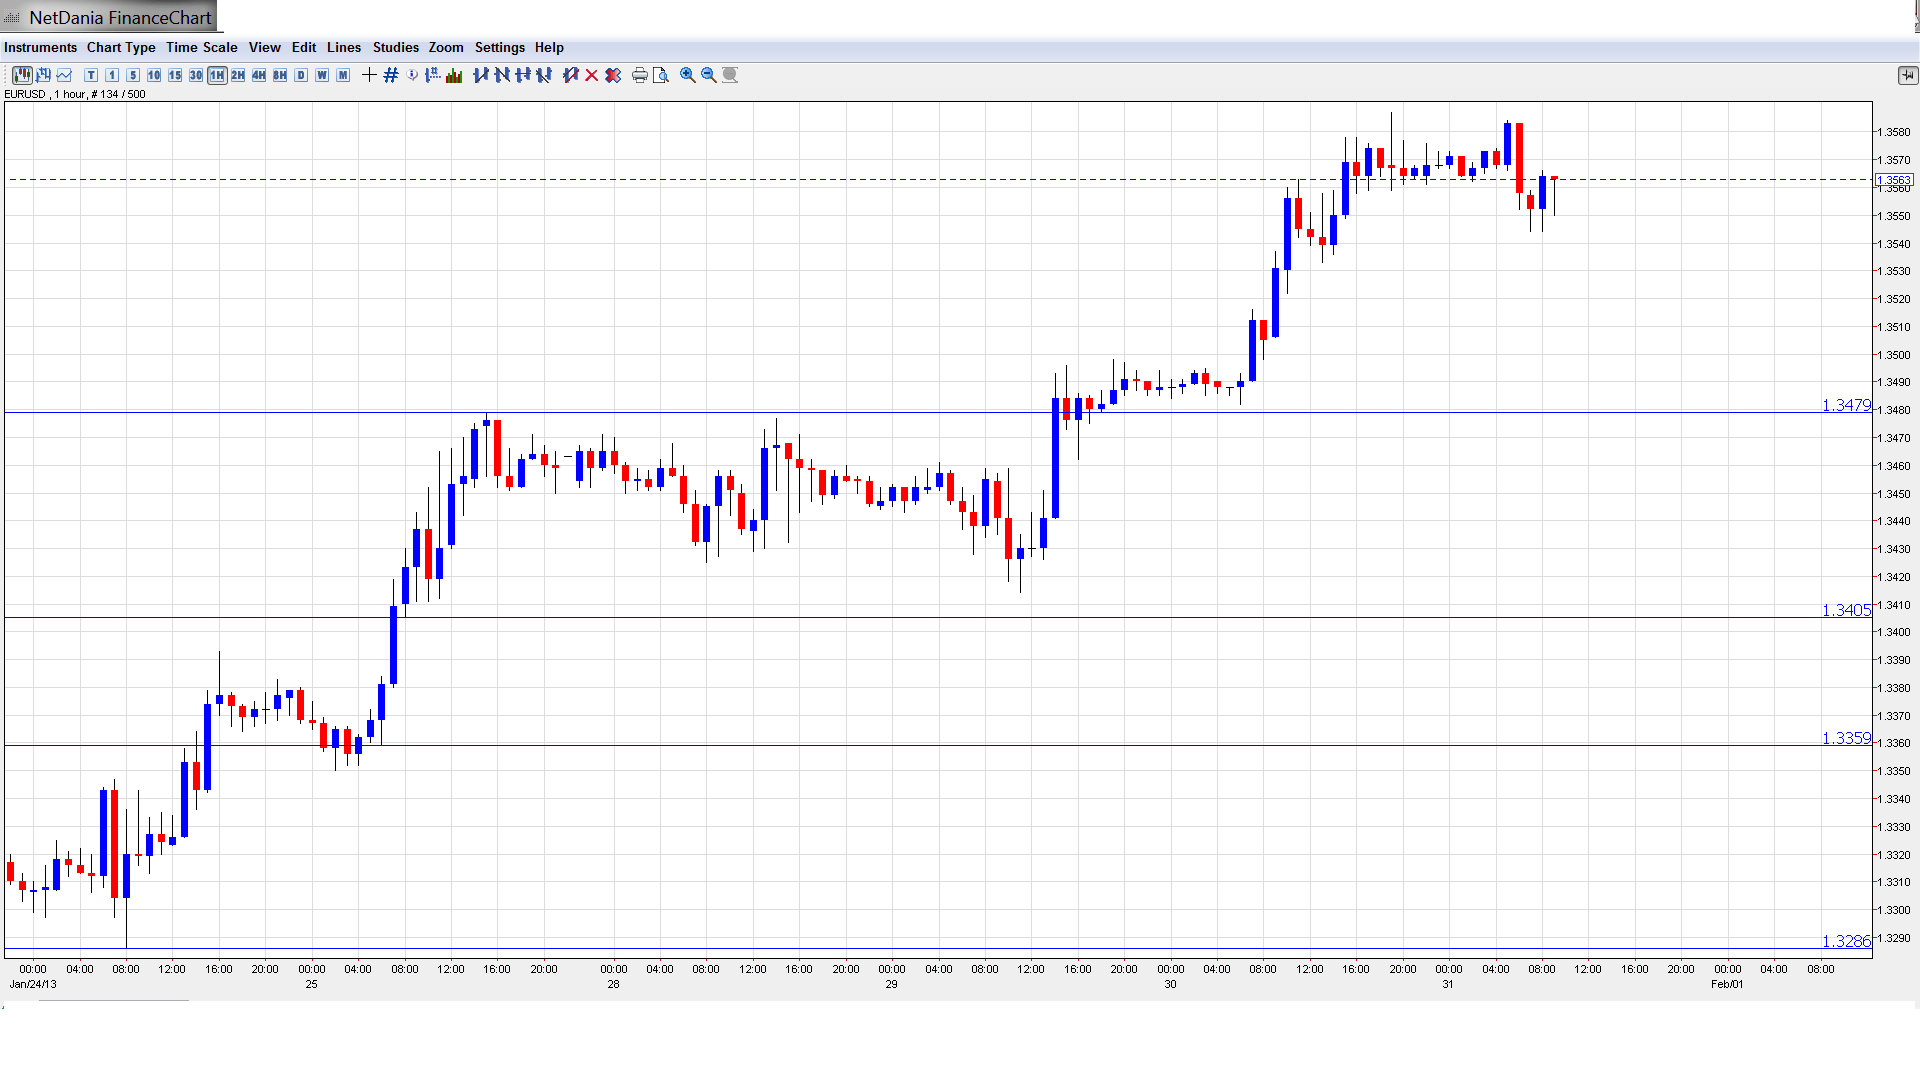
  • Asian session: Euro/dollar was quiet, reaching a high of 1.3585. The pair consolidated at 1.3555. The pair is unchanged in the European session.
  • Current range: 1.3480 to 1.36.
Further levels in both directions:EUR USD Daily Forecast January 31
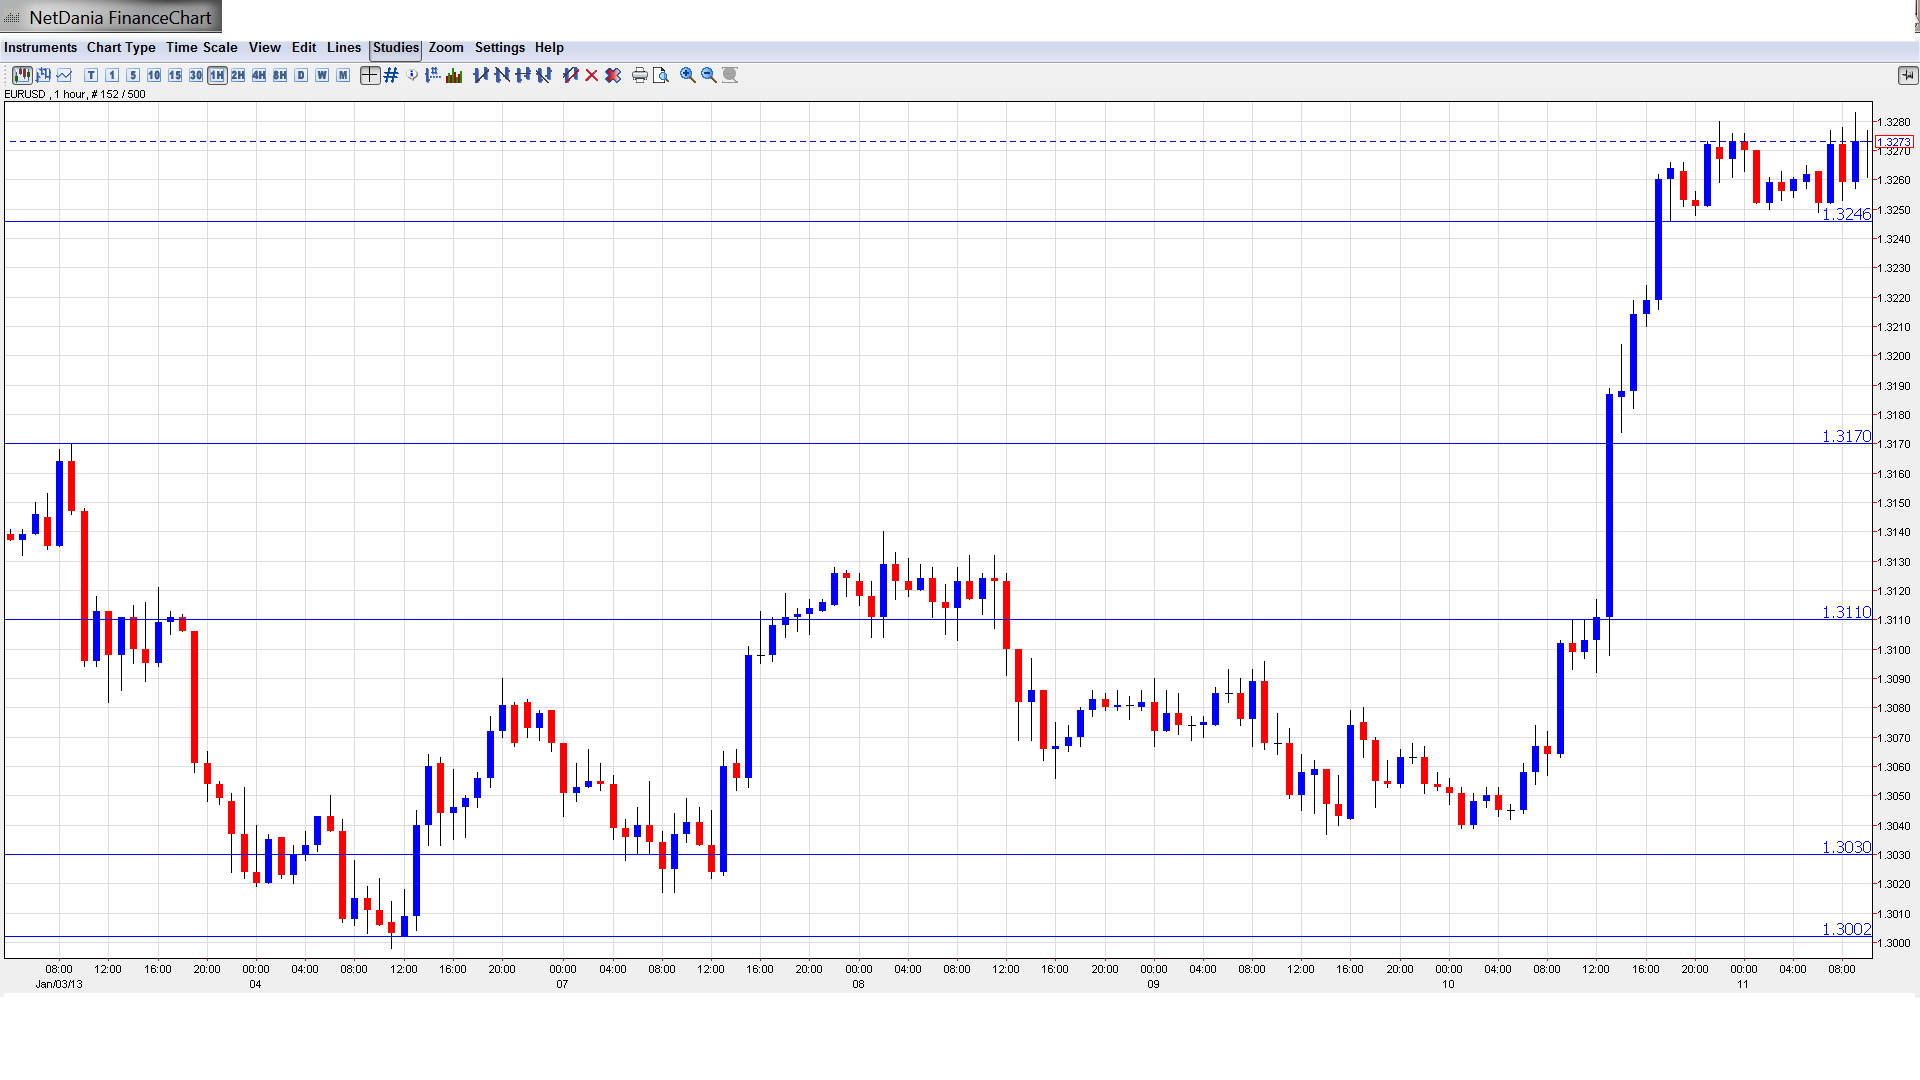
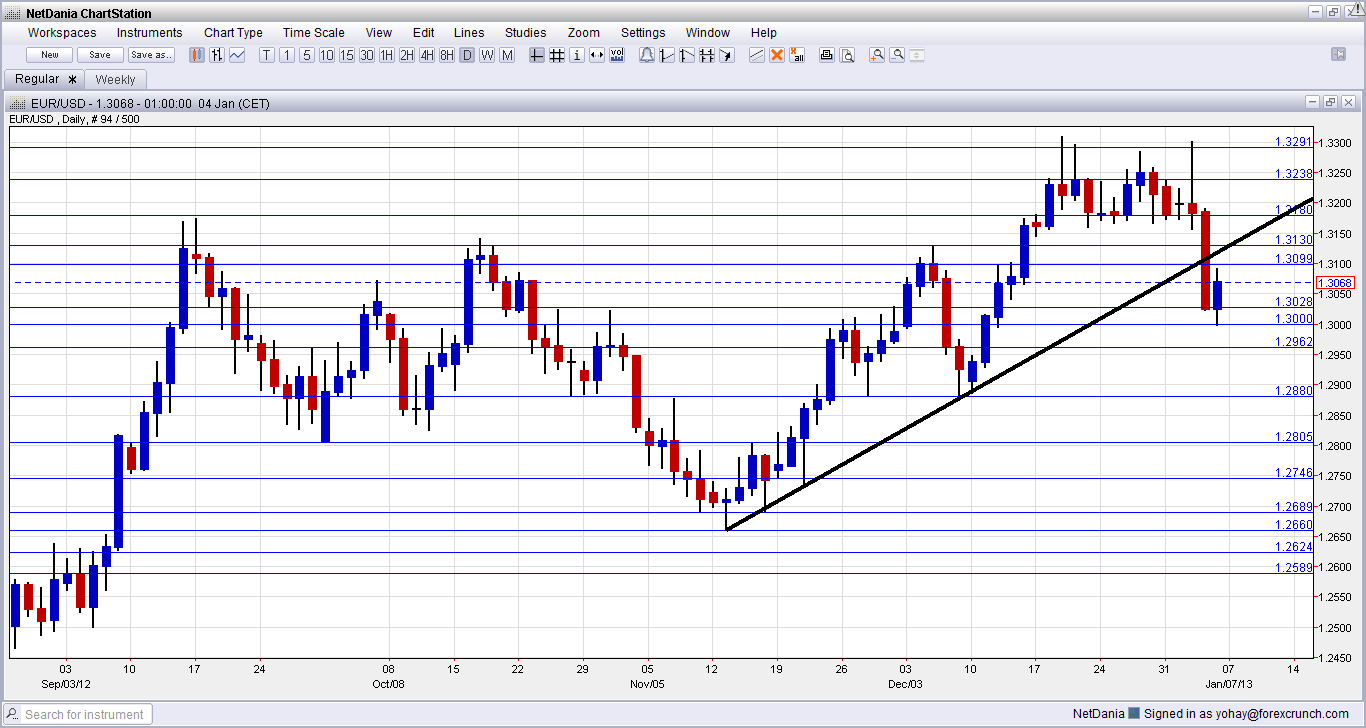
  • Below: 1.3480, 1.34, 1.3360, 1.3290, 1.3255, 1.3170, 1.3130, 1.3110, 1,3030, and 1.30.
  • Above: 1.36, 1.3690, 1.3750 and 1.3838.
  • 1.3480 has strengthened in support.
  • On the upside, 1.36 is providing resistance.
Euro/dollar steady after weak US data – click on the graph to enlarge.
EUR/USD Fundamentals
  • 7:00 German Retail Sales. Exp. 0.1%. Actual -1.7%.
  • All Day: German Preliminary CPI. Exp. -0.5%
  • 7:45 French Consumer Spending. Exp. 0.3%. Actual 0.0%.
  • 8:55 German Unemployment Change. Exp. 9K. Actual -16K.
  • 12:30 US Challenger Job Cuts.
  • 13:30 US Unemployment Claims. Exp. 362K.
  • 13:30 US Core PCE Price Index. Exp. 0.1%.
  • 13:30 US Employment Cost Index. Exp. 0.6%.
  • 13:30 US Personal Spending. Exp. 0.4%.
  • 13:30 US Personal Income. Exp. 0.7%.
  • 14:45 US Chicago PMI. Exp. 51.1 points.
  • 15:30 US Natural Gas Storage. Exp. -202B.

EUR/USD Sentiment
  • No surprises from Fed: All eyes were on the Federal Reserve this week, as the powerful US central bank met for a two-day policy meeting. There were no surprise developments, as the Fed stated it would continue its open-ended QE3 program until the outlook for the labor market “improves substantially”. This put to rest any doubts that the current round of QE, under which the Fed is purchasing $85 billion a month in securities, might be terminated anytime soon. The Fed maintained its ultra-low benchmark interest rate, saying there would be no change until unemployment drops below 6.5%. With US unemployment close to 8%, we will likely be hearing this refrain for the foreseeable future.
  • Euro sparkles: The euro continues to fly high, and has climbed above the 1.35 line, its highest level since December 2011. EUR/USD has now jumped almost 500 points since early January. The continental currency has been bolstered by improving German data, as well as optimistic forecasts about the Eurozone economy from ECB President Mario Draghi and others. These officials acknowledge that the Eurozone is going through a tough time, but are confident that the economy will bounce back later in 2013. Although a range of indicators, notably employment and PMI numbers, point to a deepening recession and continuing fallout from the debt crisis, the euro is enjoying the ride, at least for now.
  • German Data Mixed: The German locomotive will have to get back on track if the Eurozone is to get back on its feet in 2013. So how is the German economy doing? The answer seems to be lukewarm, based on recent data. Business Sentiment has improved, and unemployment numbers were excellent. At the same time, inflation indicators have been in negative territory, pointing to subdued economic activity. The manufacturing sector is struggling, and Retail Sales fell by 1.7%, well below the estimate. The markets are well aware that as goes Germany, so goes Europe, and will be hoping for better news from the bloc’s largest economy.
  • Markets fret over weak US housing numbers Although the US has posted been able to point to some strong releases recently, recent housing numbers have been in the tank. New Home Sales was a disappointment, falling well below the estimate. Pending Home Sales fared no better, plunging by 4.3%. This was the key indicator’s worst showing since last May. These dismal readings points to weakness in the US housing industry, a critical component for economic growth. The bumpy US recovery will continue to limp along if these numbers don’t improve soon.
  • US  recovery continues to hit bumps: The extent of the US recovery is anyone’s guess, as US numbers continue to keep the markets guessing. Employment and retail sales numbers have been very positive, but this has been offset by weak housing and consumer confidence data. This week’s GDP reading was abysmal, as the US economy declined by 0.1%. Although a very modest loss, there is bound to be negative market reaction, as this was the first decline since 2009, and the markets had anticipated a 1.1% gain. The US will be releasing key employment numbers on Thursday and Friday, and the markets will be hoping that the US employment picture continues to brighten.


Rabu, 30 Januari 2013

EURUSD POTENCIAL 1.3600


British net lending to individuals and mortgage approvals rose; Swiss data mixed; solid Italian auction. Market awaits ADP, GDP and FOMC. A new set of Premium Insights has been issued ahead of Wednesday's FOMC decision. 2 new trades in EURUSD, 2 new in USDJPY, 2 dual trades in GBPUSD, 2 new in AUDUSD, 2 new in EURGBP, 2 new in EURJPY and 2 new in CADJPY. Gold, silver and US crude oil trades will be updated shortly.
USD is mixed in the ongoing session. EURUSD strengthened to a 1.3562 session high, USDJPY rose to 91.39 but commodity dollars weakened and still trade near session lows.

British net lending to individuals increased in December and reached GBP 1.7 bln from prior GBP 0.1 bln and mortgage approvals rose to 56K from 54K which is the highest level since 09/2012. GBPUSD rose alongside the euro and trades around 1.5775.
The CHF strengthened despite a set of mixed data out of Switzerland. The UBS consumption indicator rose in December to 1.34 from prior 1.23 but the KOF economic barometer fell sharply in January to 1.05 from previous 1.29. USDCHF fell to 0.9155.
Italy sold 5 and 10 year BTPs totaling EUR 6.5 bln vs. 4.5-6.5 bln target. Both average yields declined and cover was mixed. Germany allotted EUR 1.637 bln of 30 year Bund vs. 2 bln target. The average yield rose to 2.45% from 2.34% and cover fell to 1.8 from 2.7. 18.2% were retained.
The US session begins at 8:15 am ET with the ADP report that is expected to decline to 164K in January from December's 215K followed by Q4 GDP at 8:30 am that is forecasted to slow to 1.2% from prior 3.1% y/y. Markets will then wait for the FOMC decision and statement at 2:15 pm. The FOMC is likely to reiterate its stance on QE so today's meeting could be a non-event.
NZD traders await the RBNZ rate decision and statement at 3:00 pm. Rates are widely anticipated to remain steady at 2.5%.


Senin, 28 Januari 2013

GBPUSD OUTLOOK


GBP/USD was down slightly this week, as the pair closed just below the 1.58 line, at 1.5795. The pound has now shed 450 points against the US dollar since the beginning of the year. There are only four events scheduled in the upcoming week, with the highlight being Manufacturing PMI. Here is an outlook of the events and an updated technical analysis for GBP/USD.
Both the UK and the US produced mixed numbers this week, resulting in modest losses for the pair. Both countries had strong employment numbers, but British GDP recorded a decline, while US housing numbers were well below expectations.
GBP/USD graph with support and resistance lines on it. Click to enlarge:  GBP USD Forecast Jan 28-Feb 1
  1. Net Lending To Individuals: Wednesday, 9:30. Increased consumer debt indicates that financial institutions are comfortable lending to consumers, and that consumers are borrowing more. The indicator has looked weak of late, posting two consecutive declines. The markets are expecting an improvement in the upcoming reading, with a forecast of a gain of 0.9 billion pounds.
  2. GfK Consumer Confidence: Thursday, 00:01. Consumer Confidence continues to be in the deep-freeze, with little optimism about the UK economy. The previous releases worsened by -29 points, and little change is expected in the January release.
  3.  Nationwide HPI: Thursday, 7:00. This housing inflation index posted very weak readings for most of 2012, pointing to very subdued activity in the UK housing market. The markets are expecting an improvement in the January release, with an estimate of a 0.3% gain.
  4. Manufacturing PMI: Friday, 9:30.The trading week wrap up with the highlight of the week. Manufacturing PMI is a key release, and an unexpected reading could impact on the movement of GBP/USD. The index surprised the markets in December by crossing above the 50 point level, for the first time since May. The estimate for January stands at 51.o points, which would indicate very slight expansion in the manufacturing industry. 
*All times are GMT
GBP/USD Technical Analysis
GBP/USD opened the week at 1.5855. The pair quickly reached a high of 1.5892, but then dropped all the way to 1.5746, briefly breaching support at 1.5750 (discussed last week). GBP recovered partially, and closed the week at 1.5795. 
Technical lines from top to bottom:
We begin with resistance at 1.6343, which was breached immediately after the fiscal cliff agreement on New Year’s Day, but has remained intact since that time. The pound has been on a steep slide since that time. Next, there is resistance at 1.6247. This is followed by 1.6122. The pair easily broke through resistance at 1.6060 and 1.5992 earlier this month, as the pound was no match for the greenback.
Next, 1.5930 could not hold on, as the pair pushed below the 1.59 line. Below, 1.5850 started off the week as a weak line, but was breached and has now reverted to a resistance role. The pound showed some improvement at the end of the week, so this line could see further activity if this upward trend can be sustained.
GBP/USD is receiving weak support at 1.5750. This line was breached on the pair’s downward push, but remained intact at week’s end. We encounter stronger support at 1.5648. Next is the line of 1.5516 has held steady since August of last year. This is followed by support at 1.5406, which has not been tested since July 2012. Below, there is support at 1.5361, which has held firm since June 2012. The pound started a rally at that time, which lasted until September. The final support level for now is at 1.5282.


Sabtu, 26 Januari 2013

Bonus 50% Berakhir Bulan Januari 2013


Trading-Point.com - XEMarkets

Bonus 50% Berakhir Bulan Ini


Notifikasi terakhir untuk Welcome Bonus dan Loyalty Bonus 50%. Promo ini tersedia untuk semua klien dan bonus diberikan untuk deposit awal maupun berulang.


EUR & GBP OUTLOOK


EURUSD finally broke to the upside: a move which was expected after a few days of sideways price action in a shape of a triangle pattern. The pair already passed the 1.3400 resistance level which now opens the door for 1.3500 or even 1.3550 level for the next few days. The trend is bullish as long as market trades above 1.3260. Meanwhile, any pull-back to 1.3350 should prove corrective.
EUR USD Elliott Wave Analysis January 25 2013
GBPUSD
The pound fell to a new low against the USD and slowed down just 5 pips from 1.5750 projected level.  Notice that pair now has five waves down from 1.6180: this is the first evidence of a coming bounce, especially if we respect the bullish divergence on the RSI. The larger pull-back however could prove corrective and may stop at 1.5900 swing level that will may react as a resistance.


Sabtu, 19 Januari 2013

EUR USD STRUGGLE


EUR/USD Daily Chart
EUR/USD (daily chart) has lingered above support at 1.3300 for the time being, but has struggled to reach the significant 1.3500 level. Price is still entrenched within a strong uptrend extending back to the July 2012 1.2041 low, and has been rather consistent in establishing higher highs during that time. After launching off the key 1.3000 area in the beginning of the year, Monday (January 14) saw price action hit a high right around the 1.3400 area, establishing a new 10-month high in the process. But a pullback slightly below 1.3300 support occurred within the next couple of days. Friday morning saw price re-approach Monday’s high, but has subsequently stalled just below it. With the high established at 1.3400, a breakout and close above it would confirm a continuation of the entrenched bullish trend, in which case price could move towards key potential resistance at 1.3500, with further potential resistance around the 1.3700 price region.


Senin, 14 Januari 2013

AUD/USD Forecast January 14-18


AUD/USD showed some upward movement during the week, but gave up most of those gains, and closed up maginally higher, at 1.0533. There are seven releases in the upcoming week, highlighted by Australian employment numbers.

The Australian dollar jumped following the release of China’s Trade Surplus, which was much higher than anticipated. However, these numbers were offset by weak numbers for Australian Building Approvals and Retail Sales, which were well below the estimate. As well, US employment numbers disappointed, raising questions about the US recovery and leading to a flight of capital to the safe-haven US dollar away from riskier assets like the aussie.

AUD/USD graph with support and resistance lines on it. Click to enlarge:
  • MI Inflation Gauge: Sunday, 23:30. This indicator helps analysts track consumer inflation on a monthly basis, as official CPI figures are only released each quarter. The index has not showed much movement of late, and declined by 0.1% in December. The markets are not expecting much change in the January release.
  • ANZ Job Advertisements: Sunday, 00:30. This important employment indicator measures the change in the number of jobs advertised in daily newspapers and websites in the major cities. The indicator has not posted a gain since April, indicating ongoing weakness in employment. Another decline is expected in this week’s release.
  • Westpac Consumer Sentiment: Tuesday, 23:30. This consumer indicator has shown some volatility of late, and dropped sharply in December, posting a decline of -4.1%. The markets are hoping that the indicator can bounce back into positive territory in the January reading.
  • New Motor Vehicle Sales: Wednesday, 00:30. This indicator is an important measure of consumer spending and confidence, as as increase in new car purchases indicates that consumers feel comfortable purchasing big-ticket items. The indicator improved to 0.0% last month, and the markets will be hoping that the upward trend continues into positive territory.
  • MI Inflation Expectations: Thursday, 00:00. This inflation indicator is useful for tracking real inflation, as consumer expectations often translates into actual inflation numbers. Currently, we are seeing a downward trend, with the indicator posting a rise of 1.8% last month. This marks the first time the indicator has fallen below the 2.0% level in over five years.
  • Employment Change: Thursday, 00:30. Employment numbers are among the most anticipated economic releases, and the readings can have a major effect on the movement of AUD/USD. The indicator has posted excellent numbers for three straight months , crushing the estimate each time. The market forecast for January stands at 2.3 thousand. Will the indicator again beat this modest estimate? The Unemployment Rate is expected to rise from 5.2% to 5.4%, and this rise could affect have a negative impact on the aussie.
  • Chinese GDP: Friday, 2:00. Chinese GDP is a key release, as China is Australia’s number one trading partner. The indicator dropped in December to 7.4%, which matched the market forecast. The markets are expecting a rebound in January, with an estimate of 7.8%.

AUD/USD Technical Analysis

AUD/USD opened at 1.0595, and then dropped to 1.0467. The pair then jumped higher, touching a high of 1.0598. The pair coughed up most of these gains, closing for the week at 1.0533, as resistance at 1.0508 remains intact.

We begin with resistance at 1.1066, which was last tested in August 2011. This is followed by 1.0990. Next is 1.0850, which has held firm since February. This is followed by resistance at 1.0739. This strong line has not been tested since early March. Below, there is resistance at 1.0605. This line held firm this week as the aussie pushed very close to the 1.06 line.

AUD/USD is receiving support at 1.0508. This line was briefly breached as the pair lost ground early in the week. Next, there is support at 1.0418. This is followed by 1.0326, which has held firm since mid-November. Below, there is support at 1.0230. We next encounter support at 1.0174, which was last tested in early October.

This is followed by 1.0080, which is protecting the parity level. The parity line, last tested in June, is psychologically significant and the next line of support. The final support level for now is at 0.9917.

Sabtu, 12 Januari 2013

EUR USD Sharply Higher As ECB Holds Rates


EUR/USD surged after yesterday’s (January 10th) ECB meeting, in which the ECB voted unanimously to maintain interest rates at 0.75%. The pair climbed about two cents following the news. The euro was also bolstered by strong data out of France, as French Industrial Production beat market expectations. In the US, Unemployment Claims was a disappointment, as the key employment indicator failed to meet the estimate for the second straight reading. It looks to be a less dramatic day on Friday, with no releases out of the Eurozone. Today’s highlight is the US Trade Balance.

EUR/USD Technical
Asian session: Euro/dollar settled down after Wednesday’s big gains, and the pair consolidated at 1.3262. The pair has edged higher in the European session.
Current range: 1.3240 to 1.3290.

Further levels in both directions:
Below: 1.3240, 1.3170, 1.3130, 1.3110, 1,3030, 1.30, 1.2960, 1.2880, 1.28, 1.2750 and 1.2690.
Above: 1.3290, 1.3350, 1.34, 1.3480, 1.3568 and 1.3627.
1.3240 is providing support. 1.3170 is stronger.
On the upside, there is resistance at 1.3290. This line could be tested if the upward move continues.

Euro/dollar jumps following ECB rate decision – click on the graph to enlarge.

EUR/USD Fundamentals
13:30 US Trade Balance. Exp. -41.1B.
13:30 US Import Prices. Exp. 0.1%.
19:00 US Federal Budget Balance. Exp. -11.6B.

For more events and lines, see the Euro to dollar forecast

EUR/USD Sentiment
  • Euro spikes after ECB rate decision: At its policy meeting on Thursday, the ECB maintained it benchmark interest rate at its current level of 0.75%. Although this move (or non-move) was widely expected, market sentiment rose after the announcement, for two reasons. First, the decision to stay the course was unanimous, and ECB President expressed his confidence in the Eurozone economy. Although growth in the zone is weak and unemployment is persistently high, the ECB decided not to change its interest rate policy in order to bolster the Eurozone. Second, there was no indication from the ECB that it might resort to slashing rates in the near future. In doing so, the ECB is sending a strong message to the markets that for the near future at least, it is likely to make do with unconventional monetary steps as it tries to help along the Eurozone economy.
  • Eurozone greets 2013 with weak numbers: After the ECB policy meeting on Thursday, ECB President Draghi expressed confidence that the Eurozone economy will bounce back in about 2013. No doubt the markets share this sentiment, but the proof will be in the Eurozone pudding. Recent data continues to point to persistent weakness in the economy. After some disappointing PMI’s last week, unemployment continues to be major headache, with the Italian unemployment rate down a notch to 11.1%, and the Eurozone rate stuck at 11.8%. Germany, the locomotive of Europe, continues to sputter, with three poor releases this past week. For any recovery to get on track, these kinds of numbers will have to improve. Otherwise, market sentiment will tumble, and likely take the euro with it.
  • German data dismal: Early on in 2013, the once mighty German economy is showing signs of weakness. After some positive employment and retail sales numbers, this week’s data has been all downhill. The Trade Balance surplus dropped to its lowest levels since May, and German Factory Orders fell by 1.2%. There was no relief from German Industrial Production. Although the indicator managed to push into positive territory for the first time since September, the gain was a paltry 0.2%, well below the estimate of 1.1%. The weak numbers threaten to undermine confidence in the Eurozone’s largest economy. Chancellor Angela Merkel is seeking a third term in national elections in September, but she will have her work cut out for her if the German economy fails to improve.
  • US Data Disappoints: There was more disappointing data out of the US on Thursday, as Unemployment Claims were released. The key employment indicator came in at 371 thousand news claims, well above the estimate of 361K. This marked the second straight reading in which the indicator failed to meet market expectations. Is the US recovery in trouble? There are worrying signs, with the staggering US debt still out of control, high unemployment and very weak consumer confidence.
  • Congress braces for new battles: Last week, the markets breathed easier as the US dodged the fiscal cliff bullet, with no time remaining on the clock. Congress managed to craft together a compromise which all sides could agree to, albeit with some reluctance on both sides of the political divide. However, the story is by no means over, and this recent battle, which grabbed the news headlines for several weeks, appears to have just been the first round. More battles are imminent, as the hard-fought fiscal cliff deal left two critical issues – the debt ceiling and spending cuts, for another day.Democrats and Republicans are likely to tangle in Congress at the end of February, as the country reaches the $16.4 trillion debt ceiling. If the debt ceiling is not raised, the result would be a default by the US government, which undoubtedly would cause chaos in the markets. Republicans have vowed to condition raising the debt ceiling on deep spending cuts, which the Democrats strongly oppose. In March, fiscal cliff could again rear its head, as $110 billion in spending cuts will kick in if Congress cannot agree on a new budget.

Minggu, 06 Januari 2013

EUR/USD Forecast


EUR/USD retreated in the first week of 2013, after another attempt to break higher evolved into a downfall. The fiscal cliff deal boost proved temporary after the Fed showed less dovishness. The focus shifts to Europe, with an all-important rate decision as well as employment data. Here is an outlook on the main market-movers this week and an updated technical analysis for EUR/USD, now at lower ground.

US politicians managed to avert the fiscal cliff, but set the ground for another crisis in two months time: the initial market cheer was also hit by Fed’s meeting minutes: is the central bank willing to ease the easing at the end of the year? Not that fast, but the euro was already hit. In the euro-zone, Spanish and German employment figures improved considerably. On the other hand, the Eurozone economies are still in a downward trend mainly Greece Spain, Italy and France struggling with high debt and low growth. How does Mario Draghi see the situation? We will know this week.

EUR/USD daily graph with support and resistance lines on it. Click to enlarge:
  1. Sentix Investor Confidence:Monday, 9:30. Sentix investors’ survey showed an improvement in in investors’ confidence in December amid the European Central Bank commitment to safeguard the euro. Investor Confidence reached -16.8, following -18.8 in November but lower than the -16.2 reading predicted by analysts. A further improvement to -13.7 is expected now.
  2. PPI : Monday, 10:00. Euro zone factory prices climbed a moderate 0.1% in October, in line with the slowing pace in consumer inflation, although higher than the flat reading forecasted by analysts. On a yearly base, producer price index was up 2.6% in October compared to the same month a year ago. A drop of 0.1% is forecasted now.
  3. German Trade Balance: Tuesday, 7:00. Germany’s trade surplus contracted in October to 15.2 billion euros from 16.9 billion in September, the lowest reading since March and also below the 15.9 billion forecasted. The reading indicates a contraction in the fourth quarter. Surplus is expected to narrow to 15.9 billion.
  4. French Trade Balance: Tuesday, 7:45. France’s trade deficit contracted for a second month in October, to 4.7 billion euros from 5.0 billion euros in September, amid a modest rise in exports. Meantime imports dropped to 42.467 billion euros from 42.535 billion the previous month. Deficit is expected to reach 4.87 billion.
  5. Retail Sales; Tuesday, 10:00. Retail sales across the European Union dropped considerably more than forecasted in October, down by 1.2% while anticipated a small drop of 0.2%, following a 0.6% fall in the previous month. The main cause for this slump is the sharp decline in Germany. This is further evidence to the gloomy situation in EU’s households. A rise of 0.5% is expected now.
  6. Unemployment Rate: Tuesday, 10:00. The eurozone’s unemployment rate reached a new record high in October climbing to 11.7% from 11.6 % in September and 10.4% a year ago. A further increase to 11.8% is expected this time.
  7. German Factory Orders: Tuesday, 11:00. Demand for German products rebounded unexpectedly in October with a 3.9% rise after a revised drop of 2.4% in September. Foreign demand was the driving force behind this jump, rising 6.7%. On an annual basis, orders were still behind last year’s levels, shrinking 2.4% in October compared to the same month a year ago. A drop of 1.4% is forecasted now.
  8. German Industrial Production: Wednesday, 11;00. German output plunged in October by 2.6% following a 1.3% decline in September indicating EU recession may be catching up with Germany. The main drop occurred in durable and capital goods production. The fourth quarter is expected to register contraction despite the holiday season shopping. An increase of 1.1% is expected now.
  9. French Industrial Production: Thursday, 7:45. French manufacturing declined by 0.7% in October, following a 2.7% slump in the previous month. The main decline occurred in transport equipment activity. The French Government is planning to grant a billion-euro tax break to compensate for spending cuts and higher consumer taxes. A rise of 0.2% is predicted.
  10. French CPI: Thursday, 7:45. Consumer Price index (CPI) declined by 0.2%, following a climb of 0.2% in October. On a yearly base, CPI rose by 1.4%. The main cause for this decline was lower prices for energy product. An increase of 0.4% is forecasted this time.
  11. Rate decision: Thursday, 12:45. press conference at 13:30. There is more than a 50/50 chance that the ECB will cut the main interest rate from 0.75% to 0.50%, but this isn’t priced in. With PMIs pointing to more weakness in manufacturing and with a weak holiday season, the ground is ready for the ECB to act. In addition, inflation is almost at the 2% target, and is forecast to slide. Mario Draghi will probably refrain from pushing the deposit rate into negative territory and leave this policy option to a future deterioration. It’s important to note that bond yields of Spain and Italy are significantly lower now. The negative rate ammunition could be kept dry for another round of the crisis. If the ECB does announce a negative deposit rate, this would be another step in the “currency wars” and the euro could tumble down.
  12. French Gov Budget Balance: Friday, 7:45. The French government budget deficit increased in October to €94.6 billion, up from a deficit of €85 billion in the previous month. However on a yearly basis, deficit contracted by €4.8 billion from €99.4 billion recorded in October of the previous year.

*All times are GMT.

EUR/USD Technical Analysis

€/$ began the week with another attempt to tackle the 1.3290 line (discussed last week). After this attempt failed, it was all downhill from there, and the pair found support only at the very round 1.30 line. It finally closed at 1.3068.

Technical lines from top to bottom:

In the distance, 1.3480 was the peak seen in February and provides a significant backstop to 1.34. 1.34 was a stubborn cap during the spring of 2012 and is the far line in the distance.

The next stepping stone is at 1.3350, which worked as a pivotal line in the past. Below, 1.3290 served as resistance before the pair collapsed in May, and despite a small breakout in December, the line remains intact -Yet another, third attempt to break higher, failed and the pair eventually collapsed in January.

1.3240 was now a pivotal line in the middle of December’s high range. It separated trading zones more than once in December and also provided some support in January. 1.3170, which was the peak of September, served as support for the pair after the break in December and is a key line on the downside.

1.3130 proved to be strong resistance during December 2012 and now switches positions to support. 1.3110 is a minor line after working as temporary resistance in December 2012.

1.3030 provided some support at the same period of time, and also at the end of November 2012. Both are minor in comparison with the next line. The very round 1.30 line was a tough line of resistance for the September rally. In addition to being a round number, it also served as strong support. In January 2013 it served as the last line of support, at least for now.

It is closely followed by 1.2960 which provided some support at the beginning of the year and also in September and October – the line is strengthening once again after temporarily cushioning the fall during December.

1.2880 provided some support in October and also in late November and December. It proved to be a backstop on the initial false rally after Obama’s victory. 1.28 is the bottom border of the range, and was eventually left behind. The pair fell to this low in September and later got close to it.

1.2750 capped the pair after the Greek elections and also had a similar role in the past. It is now a pivotal line in the range. 1.2690 was the new low after the November breakdown, and also provided support on a second downfall attempt in November 2012.

1.2624 was the low in January and now serves as weak support,1.2590 was a cap during August, before the pair surged.

Below, the round number of 1.25 is not only of high psychological significance (USD/EUR 0.80) but also worked as support during the summer of 2012. 1.2440 is already a stronger line, that was a clear separator during August.

Uptrend support lost

The thick black line on the chart shows uptrend support that began in mid-November. his line was broken in the recent downfall, and this serves as a bearish sign.


Jumat, 04 Januari 2013

USD JPY NEXT HIGH LEVEL


The rally of USD/JPY is just getting sharper and looks like a straight line up. At 88.26 at the time of writing, the pair is already at levels last seen in July 2010, before the first BOJ intervention of September 2010. Where next?
USD JPY Long Term Charts January 2013
USD JPY Long Term Charts – Click to enlarge
Many are expecting a pullback, and perhaps the US Non-Farm Payrolls could be the trigger for a pullback, regardless of the result. However, a combination of huge political will from Japan together with doubts about the infinity of the Fed’s QE programs requires a look at the next levels.
The 88 line was a double bottom during 2010. This is broken. 88.95 is the next line – this was support in early 2010.
90 is a round number but hasn’t served as support or resistance. Further above, 92.12 worked in both direction in 2009 and 2010.
A very important line is 94.70 – which capped the pair for long months in early 2010. Even higher, 97.80 capped the pair in late 2009.
The very round number of 100 is of course very important, and the last line if the vertical move continues, is 101.44, a peak in early 2009.
For more lines in the shorter term and events, see the USDJPY analysis.


NETELLER

TweeT Us